
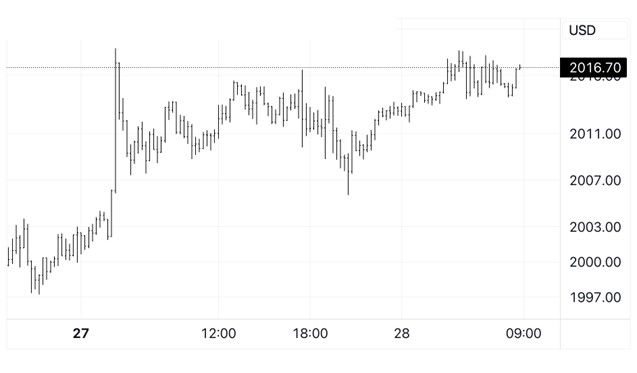
“Gold consolidated above $2000, has a solid feel with the charts pointing higher”.
Indications only | Closing prices are bids | Prices & Charts : Trading View | Market Research Refinitiv | See disclaimer below
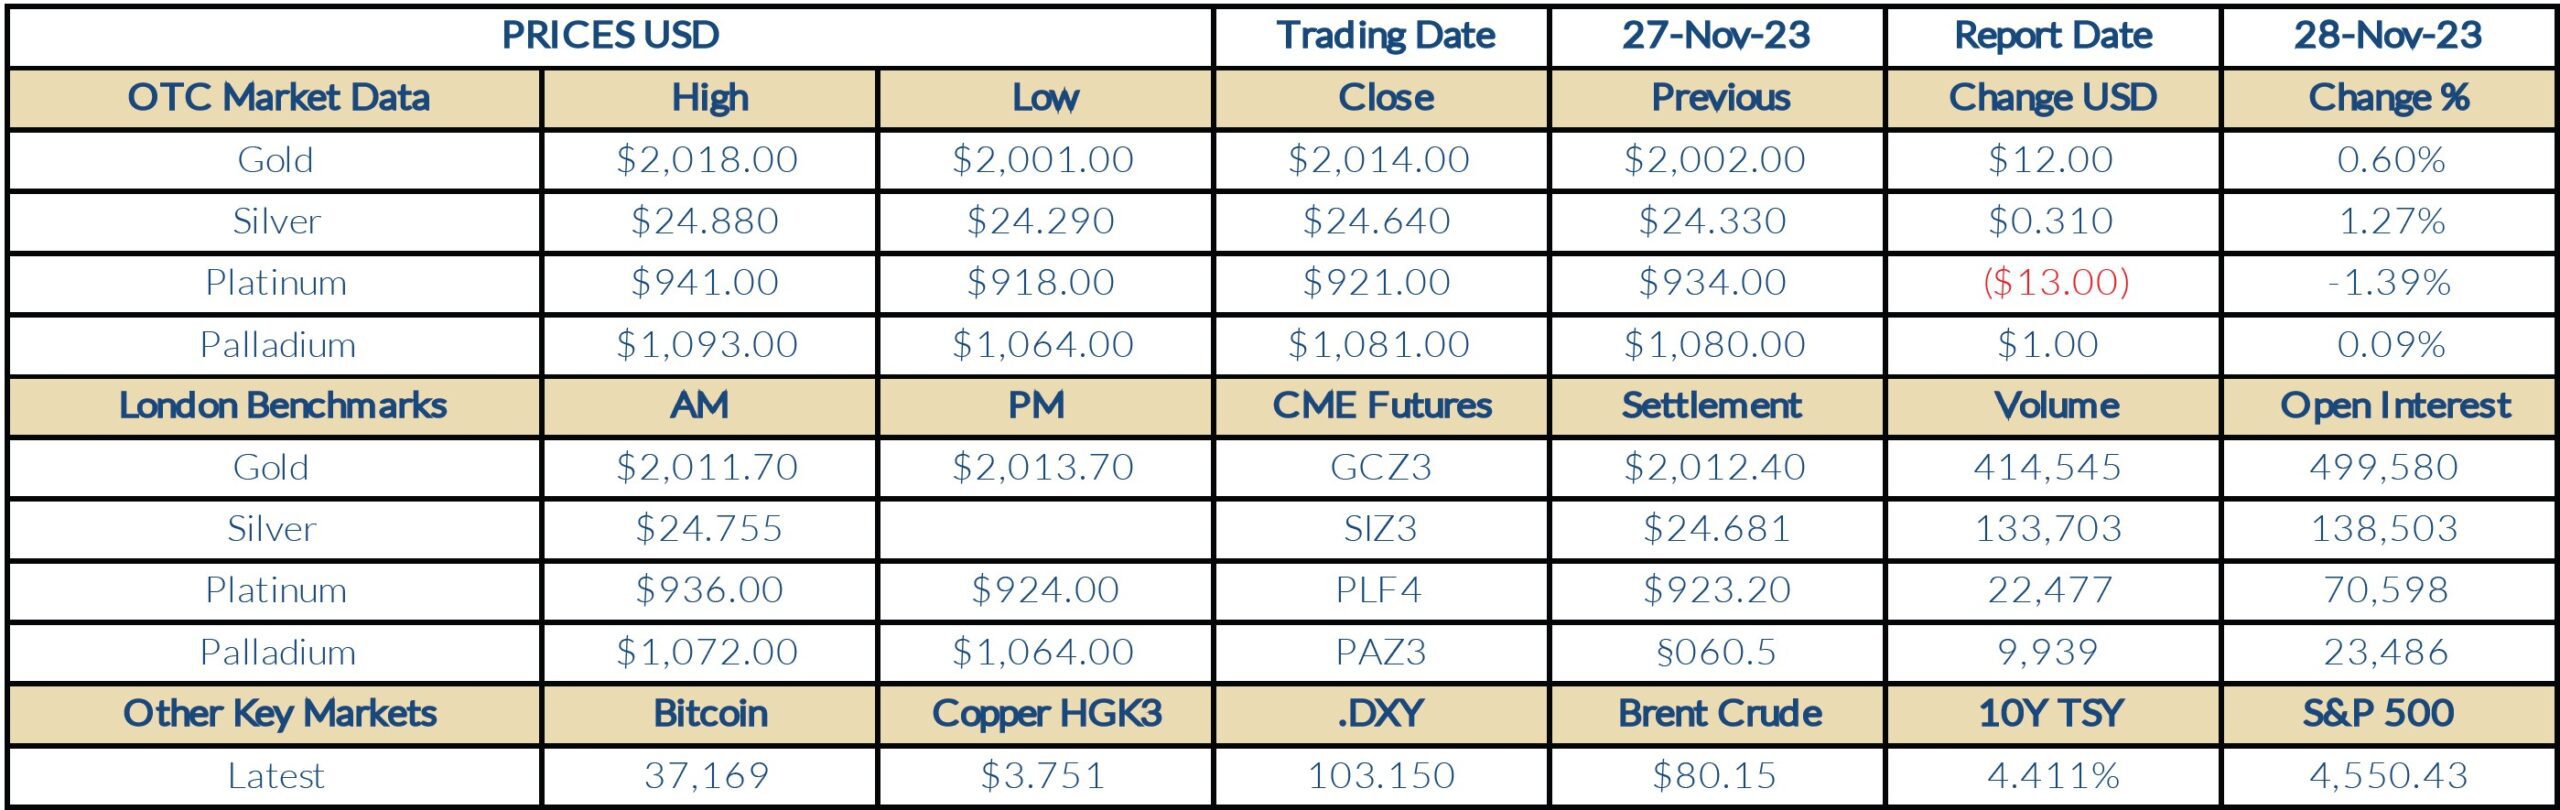
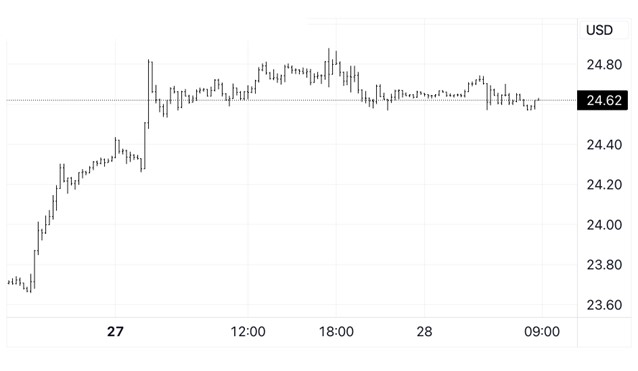
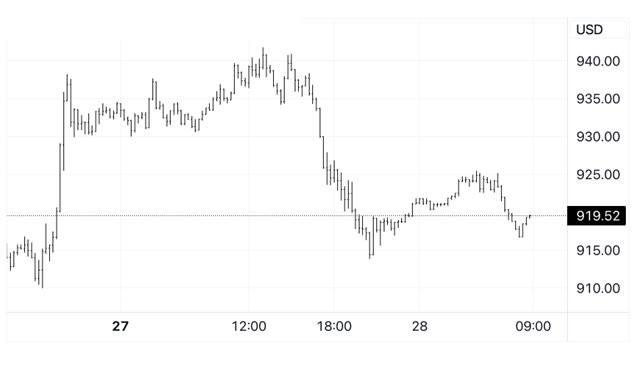
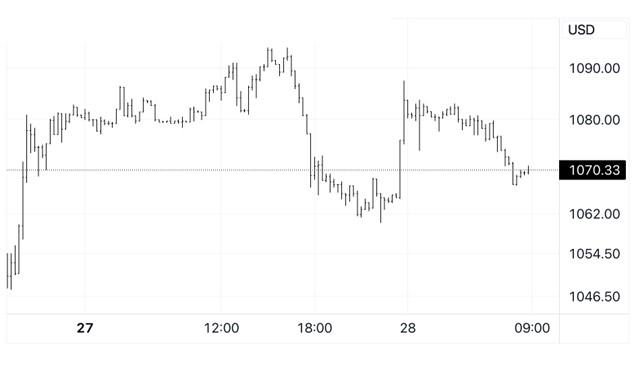
Thoughts for The Day: Gold posted its low for the day of $2001 on the opening bell in Asia on Monday but quickly spiked to a 6-month high of $2018 on technical buying after last week’s break and close above the pivotal $2000 level. The early volatility continued in Europe and New York with the price ranging between $2006 and $2016 in choppy conditions, amid heavy volume, before ending up 0.6% at $2014. The yellow metal has traded between $2012 and $2018 so far today and we can expect another active session with a potential trading range of $2005 to $2030. Silver had a strong start to the week, gaining 1.27% to $24.64, however, platinum fell 1.39% to $921 on profit taking, while palladium ended barely higher at $1081.
Market Commentary: November 28, 2023, (source Reuters)
- Gold prices climbed to a six-month peak on Tuesday, buoyed by expectations that an end to the U.S. Federal Reserve’s interest rate hike cycle would keep the dollar and yields under check. Spot gold rose 0.1% to $2,015.65 per ounce by 0243 GMT. U.S. gold futures for December delivery rose 0.2% to $2,016.10 per ounce.
- The dollar index DXY touched a near three-month low, against its rivals, making gold less expensive for other currency holders.
- Yields on 10-year Treasury notes hovered near two-month lows of 4.3630%.
- Recent data showing signs of slowing inflation in the U.S. has boosted expectations that the Fed could begin easing monetary conditions sooner than expected, with the market now awaiting PCE data – Fed’s preferred inflation gauge – on Thursday.
- Traders widely expect the U.S. central bank to hold rates in December, while pricing in about a 50-50 chance of easing in May next year, CME’s FedWatch Tool shows. Lower interest rates reduce the opportunity cost of holding non-interest-bearing bullion.
- Top consumer China’s net gold imports via Hong Kong fell for a second consecutive month in October as a patchy economic recovery weighed on demand in the key bullion market, data on Monday showed.
- Meanwhile, an Israel-Hamas truce in the Gaza Strip stretched into a fifth day as the two sides completed the release of Israeli hostages and detained Palestinians under their original ceasefire deal and appeared poised to free more.
- Spot silver gained 0.1% to $24.65 per ounce; platinum was up 0.1% to $919.70. Palladium rose 0.1% to $1,068.94 per ounce.
Economic Analysis (Trading Economics):
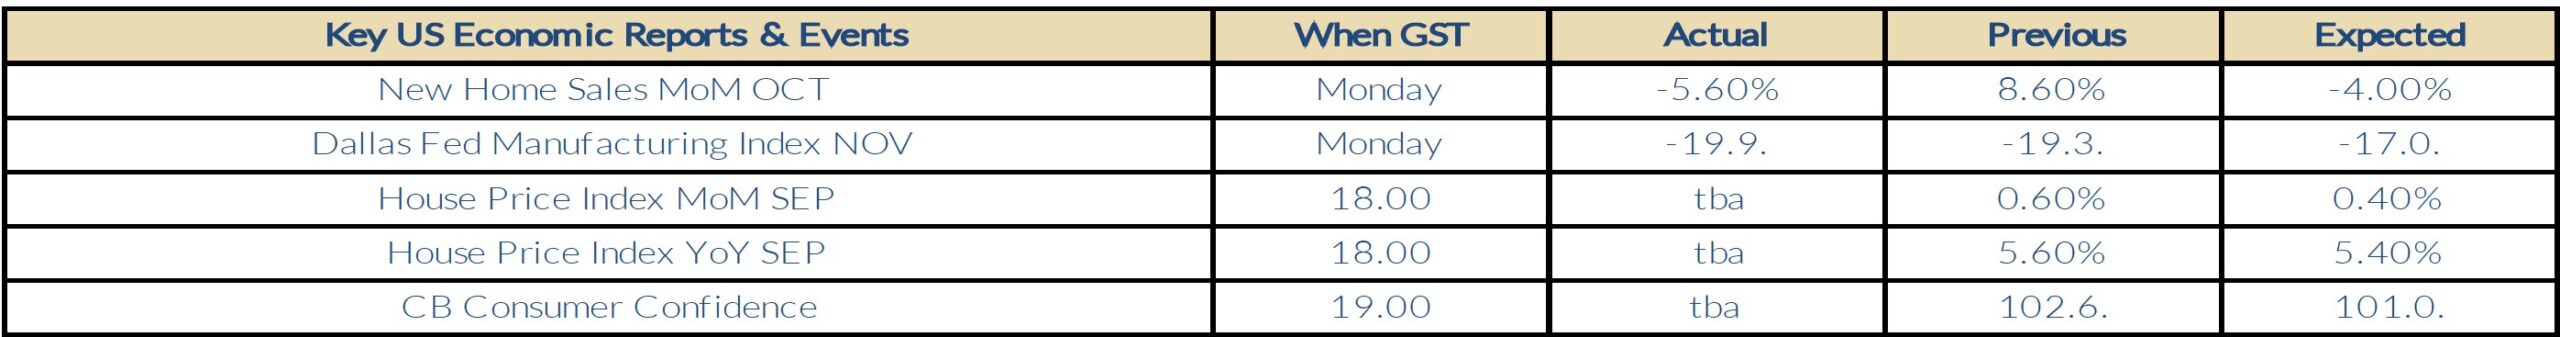
- Sales of new single-family houses in the United States fell by 5.6% to a seasonally adjusted annualized rate of 679 thousand in October 2023, well below forecasts of 723 thousand, as the highest mortgage rates in two decades weigh on buyers’ affordability. It follows a downwardly revised 719 thousand in September. In October, sales sank in the West (-23.3%) and the Midwest (-16.4%) but rose in the Northeast (13.2%) and the South (2.1%). The median price of new houses sold was $409,300, while the average sales price was $487,000 compared to $496,800 and $543,300 respectively a year ago. At the end of October, there were 439 thousand houses remaining for sale, equivalent to a 7.8-month supply at the current sales rate. source: U.S. Census Bureau
- The Federal Reserve Bank of Dallas’s general business activity index for manufacturing in Texas deteriorated for the third straight month, reaching -19.9 in November 2023, its lowest since July this year. The production index, a critical gauge of state manufacturing conditions, moved into negative territory, falling to -7.2 in November, from +5.2 in the prior month. The new orders index has been negative for 18 months and dropped to -20.5 in November from -8.8. The capacity utilization index. source: Federal Reserve Bank of Dallas
Gold Chart
Silver Chart
Platinum Chart
Palladium Chart
This document is issued by Value Trading BV. While all reasonable care has been taken in preparing this document; no responsibility or liability is accepted for errors of fact or for any opinion expressed herein. Opinions, projections and estimates are subject to change without notice. This document is for information purposes only and for private circulation. It does not constitute any offer, recommendation or solicitation to any person to enter into transaction or adopt any hedging, trading or investment strategy, nor does it constitute any prediction of likely future movements in rates or prices or any representation that any such future movements will not exceed those shown in any illustration.