
“Gold consolidates after hitting a 7-month high, focus is on the US economy”.
Indications only | Closing prices are bids | Prices & Charts : Trading View | Market Research Refinitiv | See disclaimer below
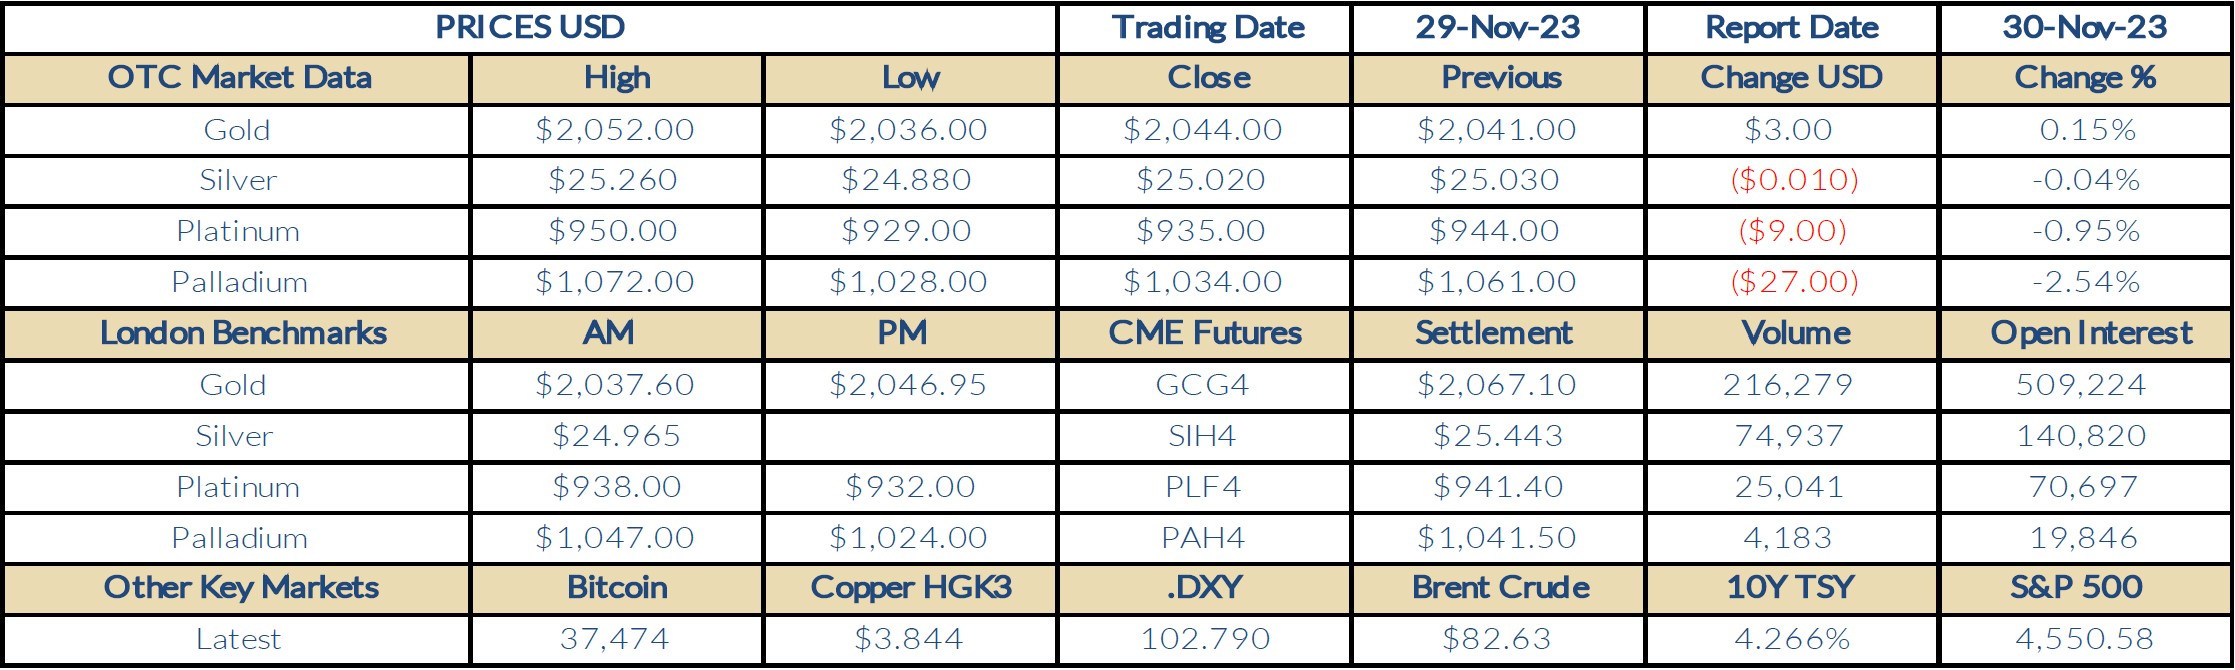
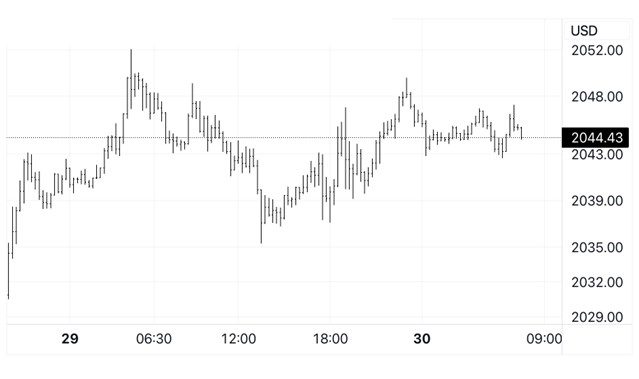
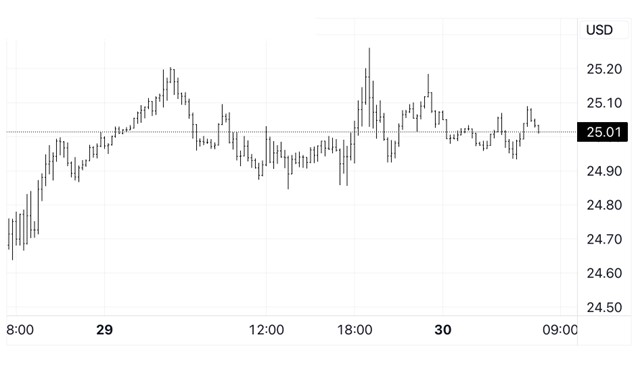
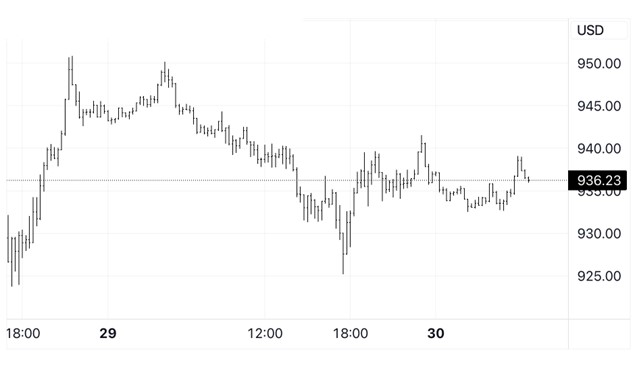
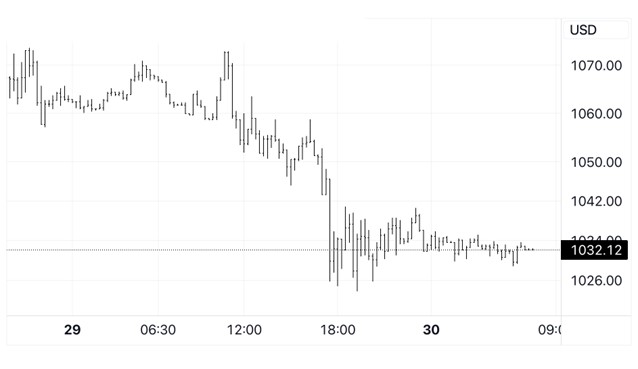
Thoughts for The Day: Gold extended its’ rally to reach a 7-month high of $2052 in early Asian trading on Wednesday but came under sustained selling pressure in Europe (profit taking from Central Banks?) that saw the AM benchmark in London set at $2037, before recovering in New York to end another active session with a marginal 0.15% gain at $2044. The yellow metal has held in a tight $2043 to $2047 range so far today but we can expect further volatility later, with the US economy in focus as the latest Personal Income and Expenditure data is released along with the PCE Price Index, an inflation measure closely watched by the Fed. If this economic indicator comes in stronger than expected, it will spark a correction back to support pegged at $2010, and help to alleviate the extreme overbought status of gold on the charts. Silver ended barely lower at $25.02, platinum fell 0.95% to $935, and palladium plunged 2.54% to $1034.
Market Commentary: November 30, 2023, (source Reuters)
- Gold prices consolidated in a tight range and hovered close to a near seven-month high on Thursday, as investors awaited key inflation print to gauge whether interest rate cuts in the U.S. would come sooner than previously expected. Spot gold was flat at $2,043.69 per ounce by 0225 GMT, after hitting its highest since May 5 on Wednesday, and was poised for its second straight monthly gain. U.S. gold futures for December delivery fell 0.2% to $2,044.20.
- The dollar index DXY drifted near three-month lows and was set to log its worst monthly performance in a year in November. A weaker dollar makes gold less expensive for other currency holders.
- Yields on 10-year Treasury notes hit a two-and-a-half-month low of 4.2210%. Federal Reserve officials this week flagged the possibility of a rate cut in the months ahead and cooling inflationary pressures. Traders have now advanced their bets for a rate cut by the U.S. central bank from an 80% chance in May to a one-in-two chance in March, CME’s Fed Watch Tool shows.
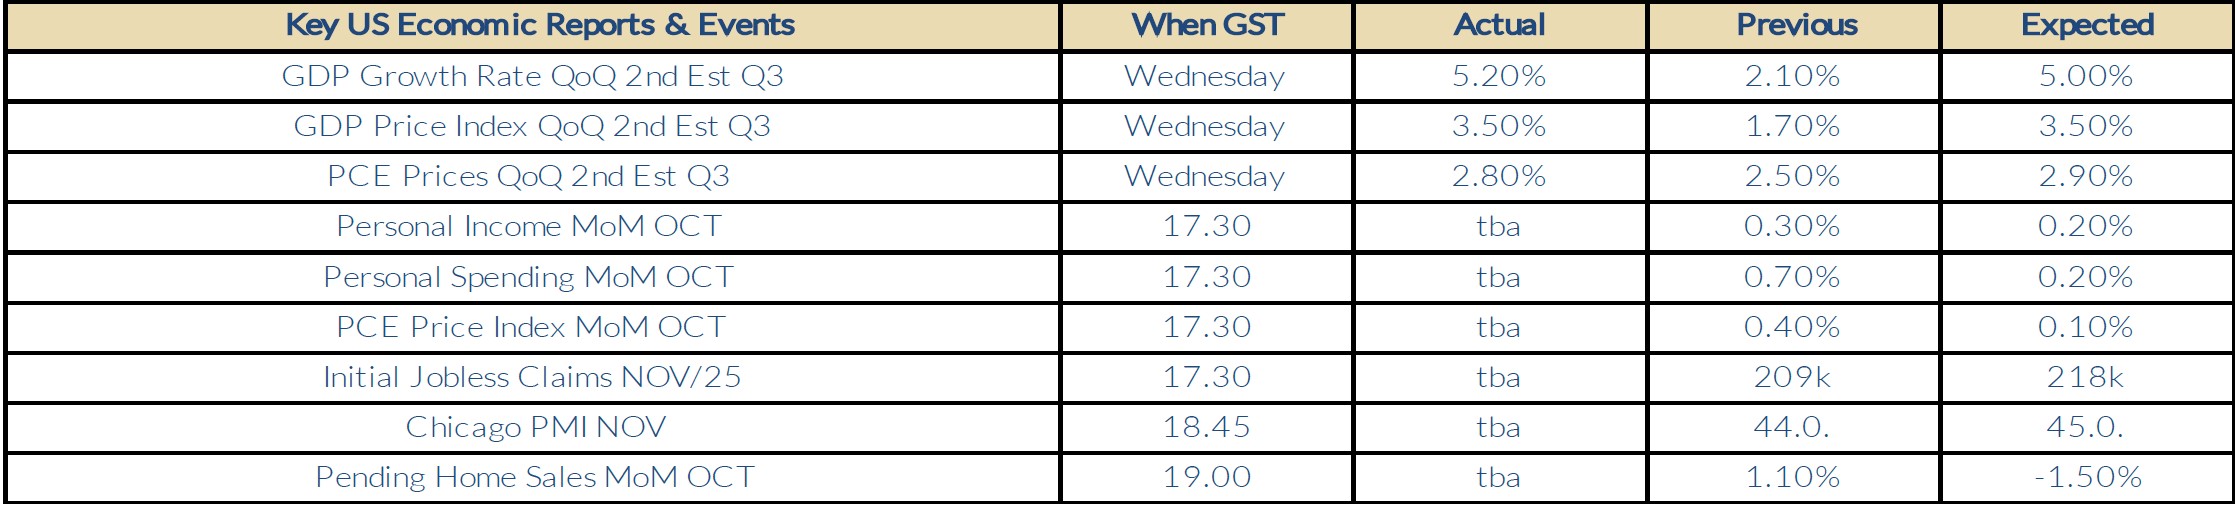
- Investor focus will be on U.S. personal consumption expenditure inflation report due at 1330 GMT and further on comments from Fed Chair Jerome Powell, who is due to speak on Friday. International pressure grew on Israel and Hamas to extend a truce after another exchange of hostages for Palestinian prisoners and humanitarian aid was delivered to the besieged Gaza Strip.
- China’s manufacturing activity contracted for a second straight month in November and at a quicker pace, an official factory survey showed, suggesting more policy support measures are needed to help shore up economic growth.
- Spot silver fell 0.1% to $24.99 per ounce. Platinum was also down 0.1% to $931.28. Palladium fell 0.2% to $1,025.58 per ounce.
Economic Analysis (Trading Economics):
The US economy expanded an annualized 5.2% in Q3 2023, higher than 4.9% in the preliminary estimate, and forecasts of 5%. It marks the strongest growth since Q4 2021. Non-residential investment was revised higher to show a 1.3% rise instead of a 0.1% fall initially estimated, as the drop in equipment was shorter (-3.5% vs -3.8% in the advance estimate) and structures surged 6.9% (vs 1.6%). Also, residential investment rose for the first time in nearly two years and at a much faster pace than initially expected (6.2% vs 3.9% in the advance estimate). Meanwhile, private inventories added 1.4 pp to growth, above 1.32 pp in the previous estimate and government spending increased faster (5.5% vs 4.6%). On the other hand, consumer spending went up 3.6%, slightly less than 4% in the advance estimate, but remaining the biggest gain since Q4 2021. The slowdown was mainly due to services spending. Exports soared 6% (vs 6.2%) and imports increased less (5.2% vs 5.7%). source: U.S. Bureau of Economic Analysis
Gold Chart
Silver Chart
Platinum Chart
Palladium Chart
This document is issued by Value Trading BV. While all reasonable care has been taken in preparing this document; no responsibility or liability is accepted for errors of fact or for any opinion expressed herein. Opinions, projections and estimates are subject to change without notice. This document is for information purposes only and for private circulation. It does not constitute any offer, recommendation or solicitation to any person to enter into transaction or adopt any hedging, trading or investment strategy, nor does it constitute any prediction of likely future movements in rates or prices or any representation that any such future movements will not exceed those shown in any illustration.