
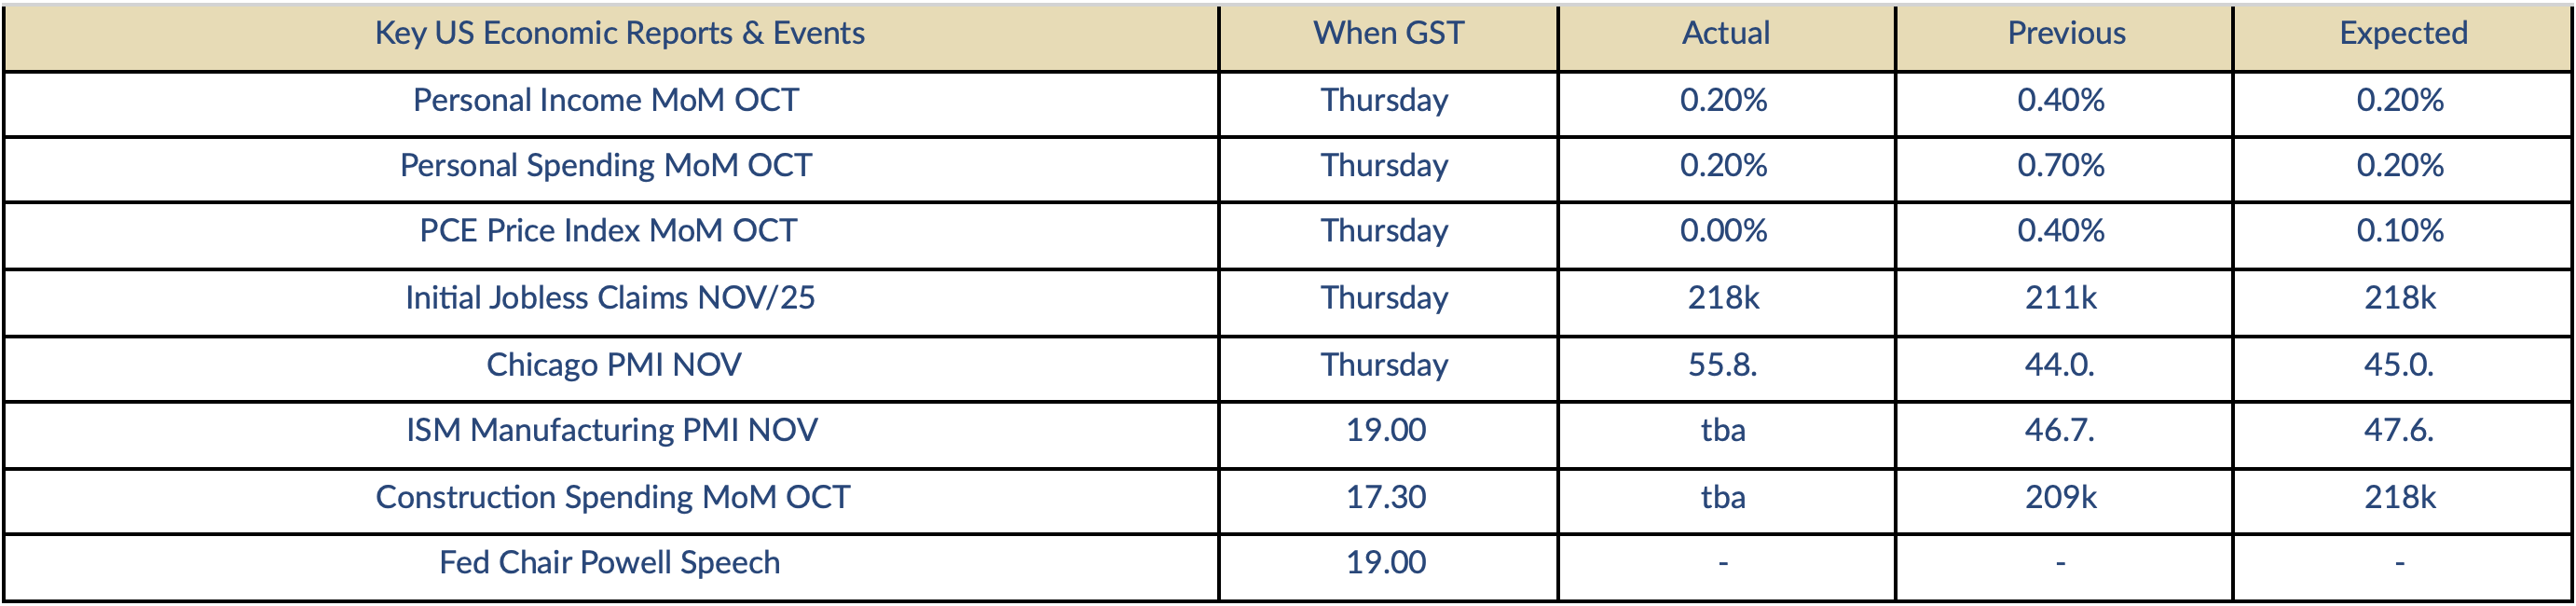
“Gold eases for the 2nd day in a row but remains technically overbought”.
Indications only | Closing prices are bids | Prices & Charts : Trading View | Market Research Refinitiv | See disclaimer below

Thoughts for The Day: Gold was steady in Asia on Thursday, posting a high for the day of $2047 but came under pressure in Europe with the price easing to $2037.85 at the AM benchmark in London, suggesting selling from either Central Banks or producers, or perhaps more likely a combination of both. This was followed by a bounce to $2045 shortly after the New York opening, following benign inflation data, but the recovery was short-lived with the price falling to a low for the day of $2032 amid moderate trading volume as the USD rallied and US10YT yields posted modest gains. The yellow metal ended down 0.39% at $2036 and has traded actively between $2034 and $2043 so far today, setting the scene for a volatile final session of the week. Silver bucked the bearish trend in the precious metals sector, gaining 1% to end near the highs at $25.27, while platinum fell 0.64% to $929 and palladium added another 2.22% to the previous day’s sharp sell-off, ending at $1011.
Market Commentary: December 1, 2023, (source Reuters)
- Gold prices looked set to mark a third straight weekly rise on Friday, after data showing cooling inflation cemented bets for a rate cut in the U.S., with traders now looking forward to comments from Federal Reserve’s Chair Powell later in the day. Spot gold rose 0.2% at $2,039.63 per ounce by 0301 GMT, after marking an over $60 rise in November – its second straight monthly rise. S. gold futures for February delivery rose 0.1% to $2,059.30.
- Data on Thursday showed U.S. consumer spending rose moderately in October, the annual increase in inflation was the smallest in more than 2-1/2 years.
- The dollar index DXY fell by 0.2%, after clocking its weakest monthly performance in a year in November, despite a 0.6% jump overnight. A weaker dollar makes gold less expensive for other currency holders.
- Yields on 10-year Treasury notes also ticked lower. Meanwhile, more Americans applied for unemployment benefits last week and the number on jobless rolls surged to a two-year high in mid-November, pointing to a gradually easing labour market. Cooling inflationary pressures, and an easing labour market make case for an end to the Federal Reserve’s interest rate hiking campaign and a possibility of rate cuts in the months ahead, a rhetoric that two Fed officials also flagged this week.
- Traders have advanced their bets for a rate cut by the U.S. central bank from about an 80% chance in May to a one-in-two chance in March, CME’s FedWatch Tool shows. Lower interest rates reduce the opportunity cost of holding non-interest-bearing bullion.
- Negotiators worked feverishly to renew the pause in fighting between Israel and Hamas in Gaza as a senior Israeli official reiterated plans to resume the war unless the Palestinian militant group agreed to release more hostages.
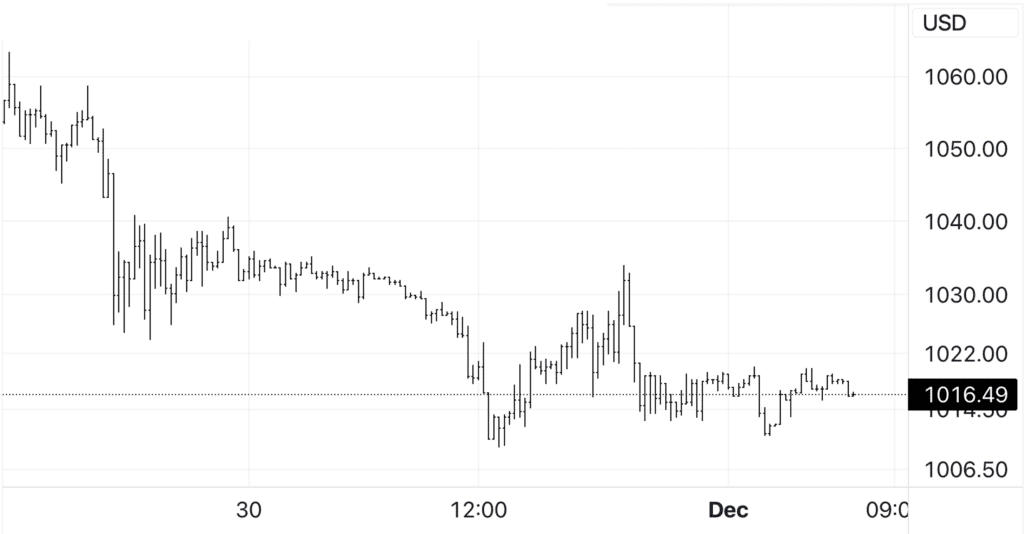
- Spot silver was steady at $25.24 per ounce. Platinum was down 0.3% to $924.17. Palladium rose 0.6% to $1,013.84 per ounce.
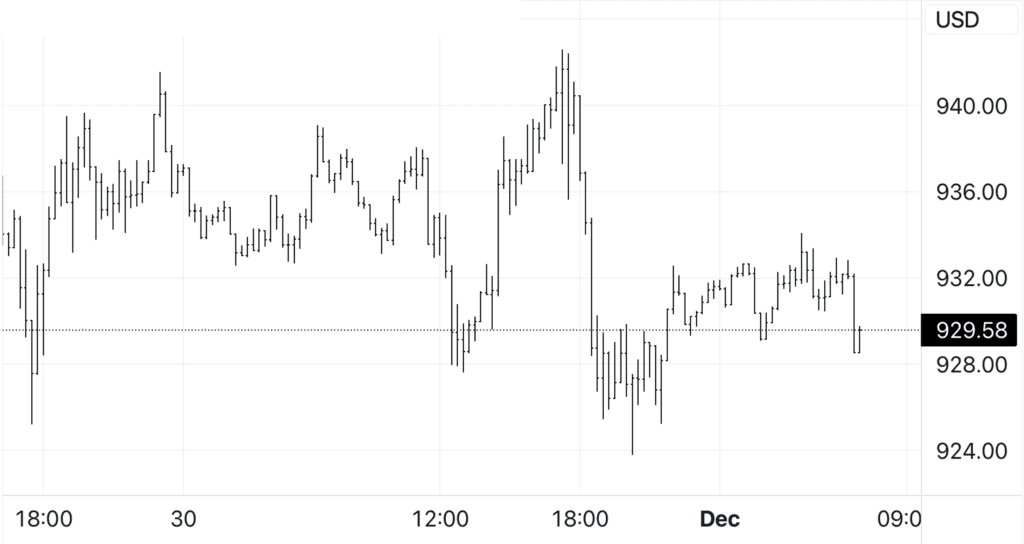
Economic Analysis (Trading Economics):
The personal consumption expenditure price index in the US was flat month-over-month in October 2023, the weakest reading since July 2022, after a 0.4% rise in both September and August, and compared to forecasts of 0.1%. A 0.3% decline in the prices of goods offset a 0.2% rise in the cost of services. Also, the annual rate cooled to 3%, the lowest since March 2021, from 3.4% in September and matching forecasts. Meanwhile, monthly core PCE inflation which excludes food and energy and is the preferred Fed measure of inflation, eased to 0.2% from 0.3%. Separately, the energy index declined by 2.6% month over month, while the food measure was up by 0.2%. Finally, the annual core inflation rate slowed to 3.5% from 3.7%, a fresh low since mid-2021. source: U.S. Bureau of Economic Analysis
Gold Chart
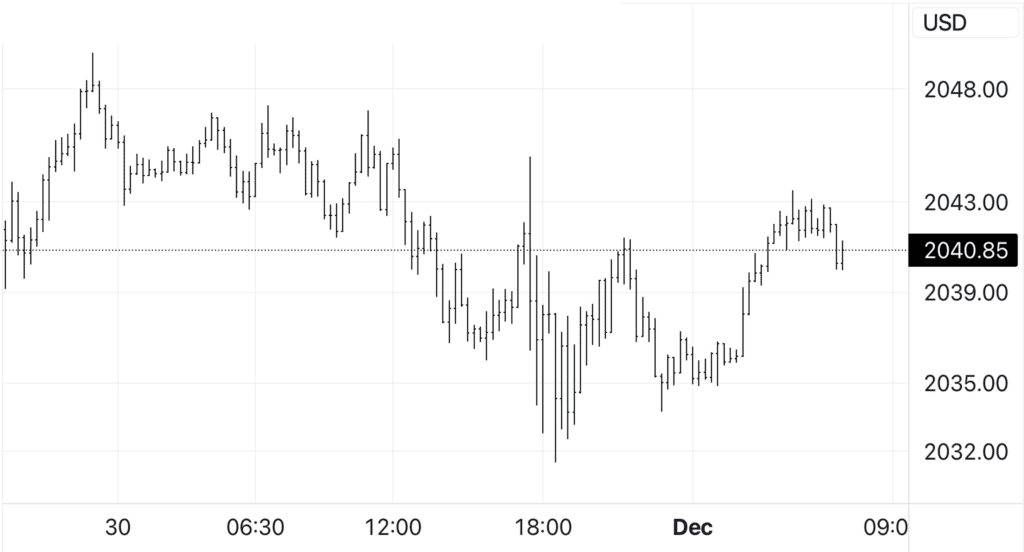
Silver Chart
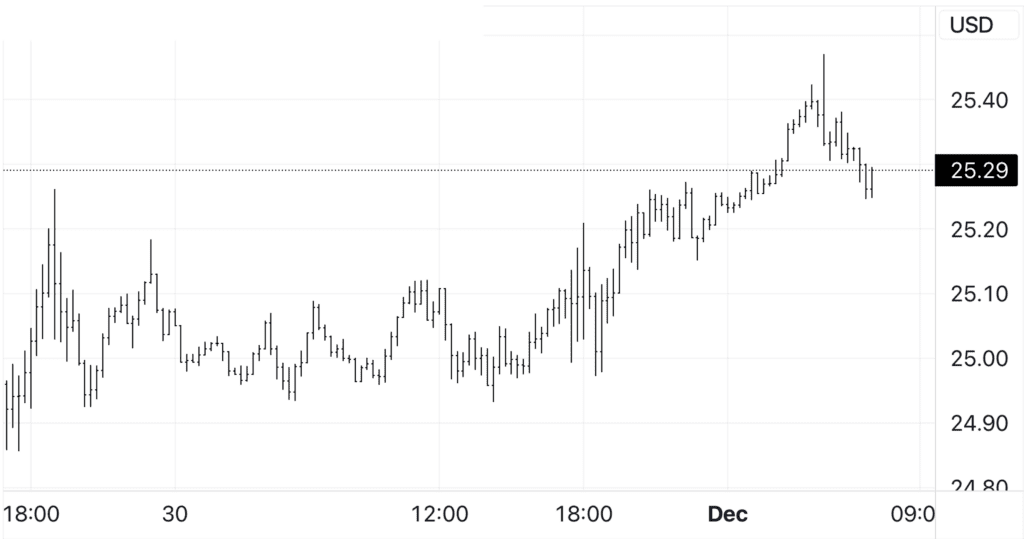
Platinum Chart
Palladium Chart
This document is issued by Value Trading BV. While all reasonable care has been taken in preparing this document; no responsibility or liability is accepted for errors of fact or for any opinion expressed herein. Opinions, projections and estimates are subject to change without notice. This document is for information purposes only and for private circulation. It does not constitute any offer, recommendation or solicitation to any person to enter into transaction or adopt any hedging, trading or investment strategy, nor does it constitute any prediction of likely future movements in rates or prices or any representation that any such future movements will not exceed those shown in any illustration.