
“Gold posts a record close on Friday then surges to an all-time high of $2148 this morning in Asia”.
Indications only | Closing prices are bids | Prices & Charts : Trading View | Market Research Refinitiv | See disclaimer below
Weekly Recap
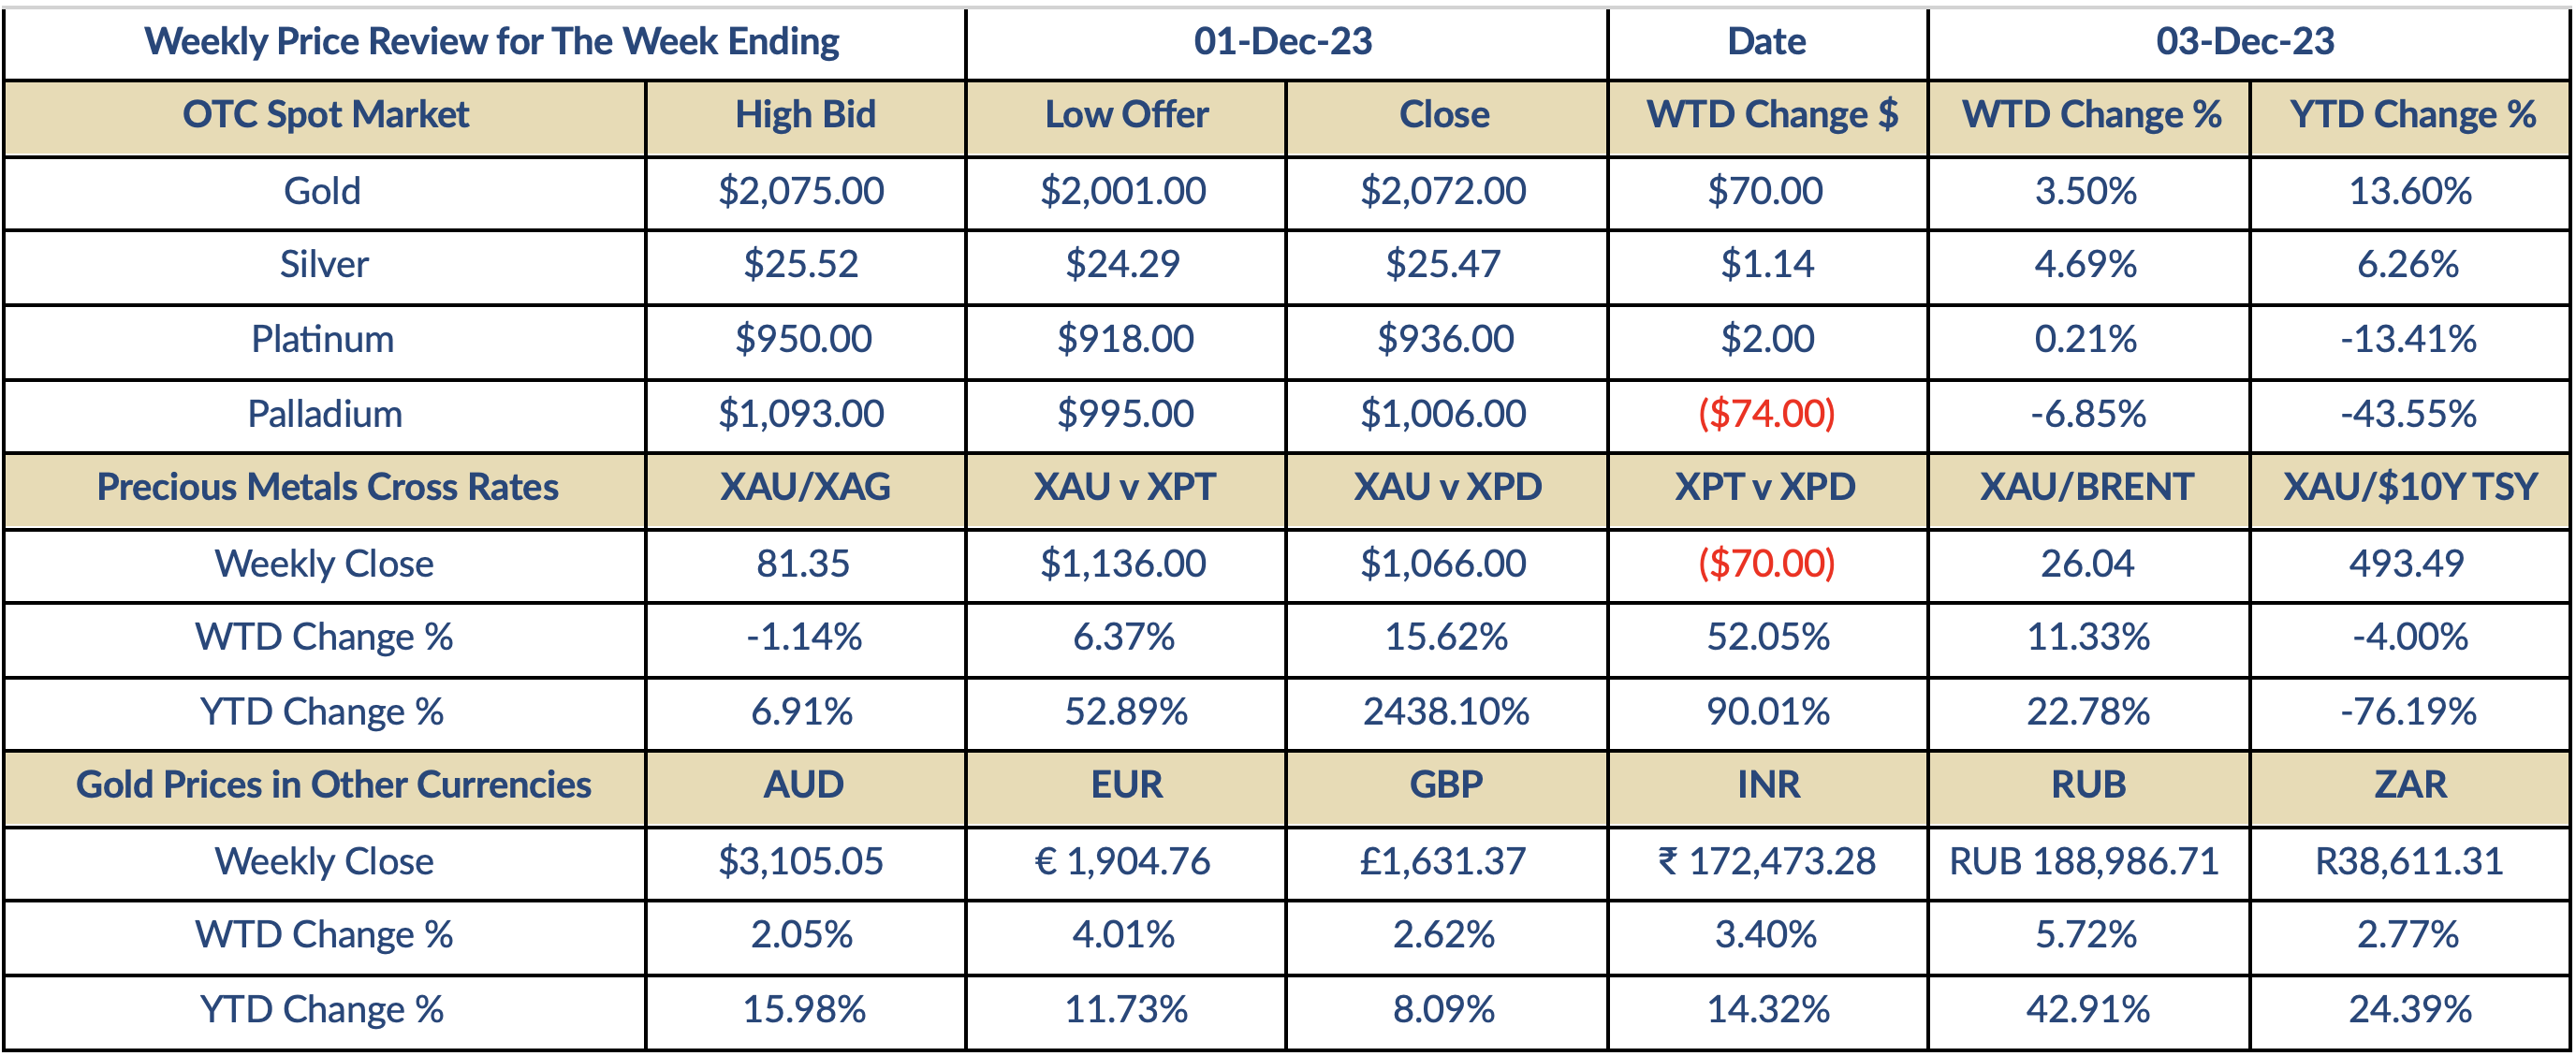
Monday – Gold posted its low for the day of $2001 on the opening bell in Asia on Monday but quickly spiked to $2018 on technical buying after the previous week’s break and close above the pivotal $2000 level. The early volatility continued in Europe and New York, with the price ranging between $2006 and $2016 in choppy conditions, amid heavy volume, before ending up 0.6% at $2014. Silver had a strong start to the week, gaining 1.27% to $24.64, however, platinum fell 1.39% to $921 on profit taking, while palladium ended barely higher at $1081.
Tuesday – Gold flatlined in Asia and Europe between a low for the day of $2012 and $2018 on Tuesday, consolidating the break above the pivotal $2000 level, before surging to a 7-month high of $2043 in New York on heavy trading volume as the USD fell sharply and US10YT yields plunged on dovish rhetoric from Fed members that intensified the noise that the next move on interest rates by the US Central Bank will be to cut next year. The yellow metal ended up 1.34% at $2041, silver tracked gold, ending on the highs and up 1.58% at $25.03; platinum posted a sector leading gain of 2.5% to $944, but palladium bucked the bullish trend to end down 1.85% at $1061.
Wednesday – Gold extended its’ rally to $2052 in early Asian trading on Wednesday but came under sustained selling pressure in Europe (profit taking from Central Banks?) that saw the AM benchmark in London set at $2037, before recovering in New York to end another active session with a marginal 0.15% gain at $2044. Silver ended barely lower at $25.02, platinum fell 0.95% to $935, and palladium plunged 2.54% to $1034.
Thursday – Gold was steady in Asia on Thursday, posting a high for the day of $2047 but came under pressure in Europe with the price easing to $2037.85 at the AM benchmark in London, suggesting selling from either Central Banks or producers, or perhaps more likely a combination of both. This was followed by a bounce to $2045 shortly after the New York opening, following benign inflation data, but the recovery was short-lived with the price falling to a low for the day of $2032 amid moderate trading volume as the USD rallied and US10YT yields posted modest gains. The yellow metal ended down 0.39% at $2036, silver bucked the bearish trend in the precious metals sector, gaining 1% to end near the highs at $25.27, while platinum fell 0.64% to $929 and palladium added another 2.22% to the previous day’s sharp sell-off, ending at $1011.
Friday – Gold was choppy in Asia and Europe on Friday, trading between $2035 and $2050, but this was only a precursor to a record-breaking session in New York where the price surged to $2075, matching the all-time high posted in May, amid heavy trading volume as Jerome Powell’s speech was interpreted as dovish and signalling a possible interest rate cut as early as March next year. The yellow metal held on to most of its’ gains to end a dramatic day up 1.77% at $2072, representing a record closing price and a gain of 3.50% on the week. Silver posted a 7-month high of $25.52 before easing back to end up 0.79% on the day and a sector leading 4.69% for the week at $25.47; platinum gained 0.75% to $936 on Friday and was up a marginal 0.21% on the week; palladium ended down 0.49% at $1006 and had fallen 6.85% over a disappointing week.
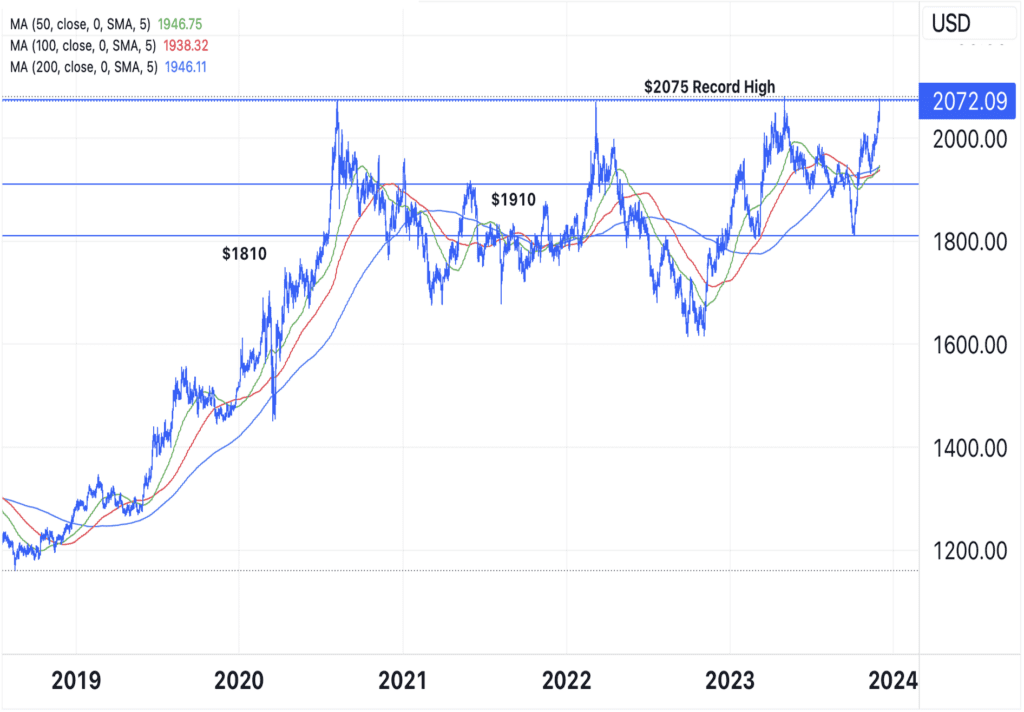
Gold Chart
Last week we predicted a test of key resistance pegged at $2010 with a break targeting $2050, and while we got direction right, we underestimated the power of gold’s rally with the price matching the all-time high of $2075 on Friday that had been reached three time before, in August 2020, March 2022, and most recently May this year. The record close, combined with an intensification of the conflict in the Middle East, to generate a spike to a fresh peak of $2148 this morning in an ultra-thin Asia market with gold entering into technical clear air with a top very difficult to call. The price has eased to $2085, and many players will adopt a ‘wait and see’ approach until the market stabilises. However, the latest leg in gold’s bull run has left it extremely overbought with a 30-day RSI reading of 76 and vulnerable to a sharp correction back to previous resistance pegged at $2050, with potential to reach $2010 before the end of the year. The US economy will be back in focus this week with the release of the latest US employment data on Friday that will either intensify noise about a Fed rate cut or result in a rally of the USD and US10YT yields. An extremely wide trading range of $2150 to $2025 would be no great surprise this week.
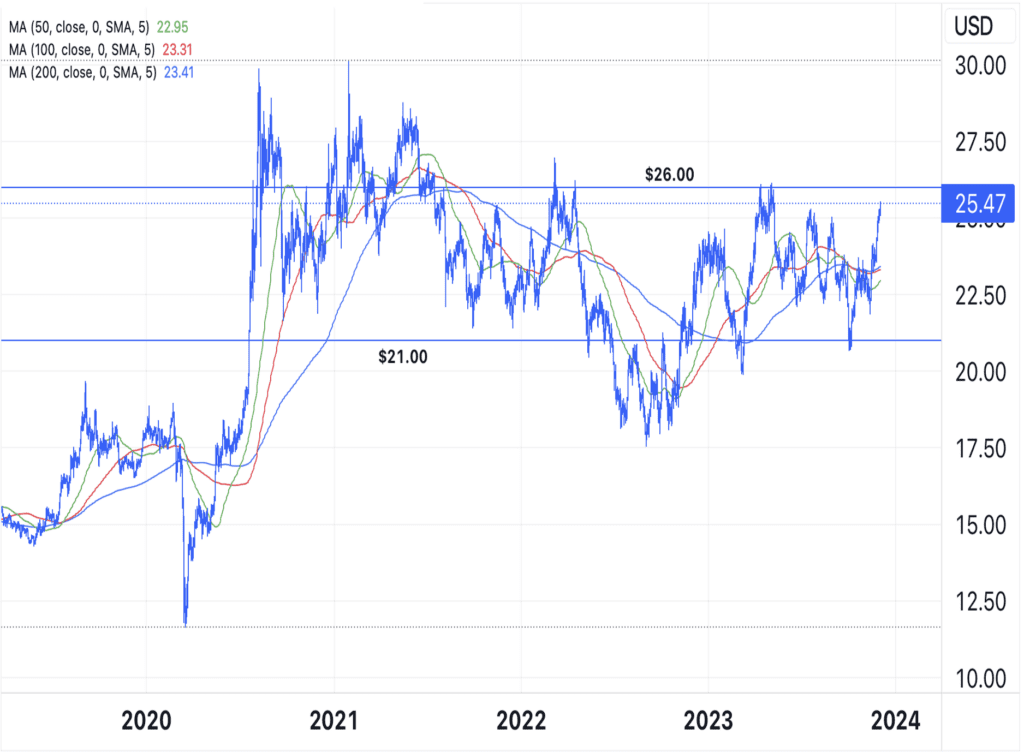
Silver Chart
Despite gold’s record-breaking rally, silver was the best performer in the precious metals sector last week with a gain of $1.14 per oz, or 4.69% and the industrial precious metal has extended its’ rally to $25.91 this morning as it tracked the yellow metal higher. It looks set to test key long-term resistance located at $26 this week, with a clear break bringing the next major resistance, located at $28 on to technical radar screens. The cluster of moving averages around $23 should now support any moves to the downside., suggesting a trading range of $23 to $28 in December.
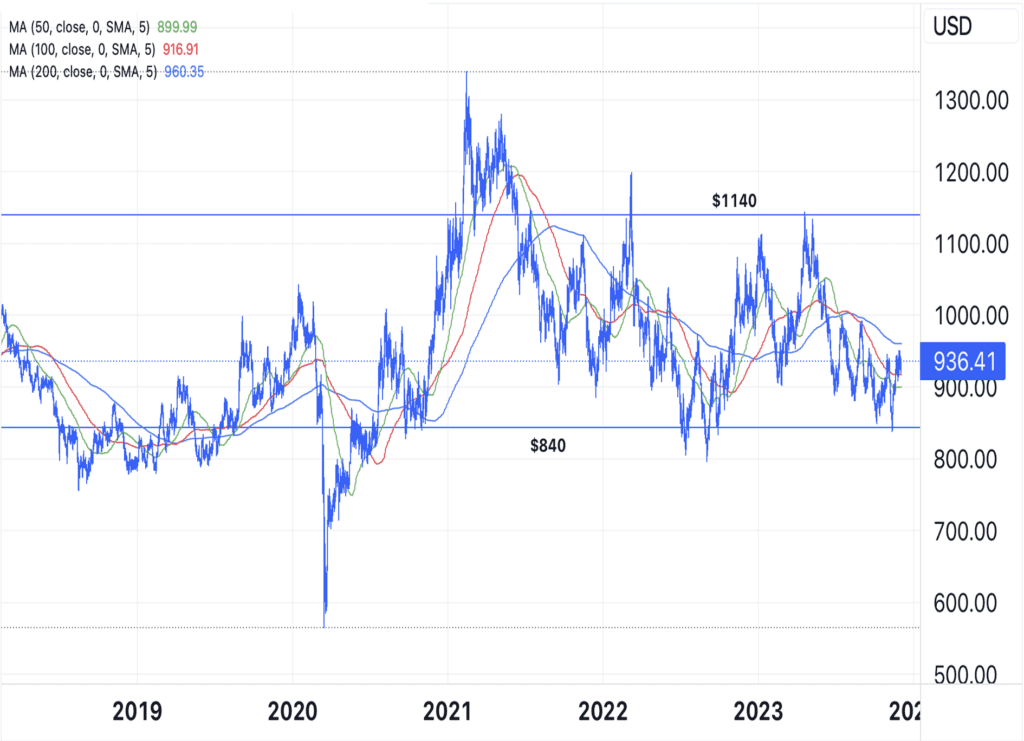
Platinum Chart
After a torrid two years that saw platinum lose 40% of its value, falling from $1340 in February 2021 to $800 in September 2022 on concerns about demand from the auto sector in the wake of COVID and its impact on industrial demand, platinum has shown a welcome return to form this year as the noble metal rallied 42% to $1140 in April. However, the Fed’s relentless approach to monetary policy, with a series of interest rate hikes, took its toll with platinum falling back to a low for the year to date of $840 last month. Since then, the price has tracked gold higher to reach $950 and is on course to test the 200-day MA pegged at $960 with a clear break bringing the pivotal $1000 level back into play before the year end.
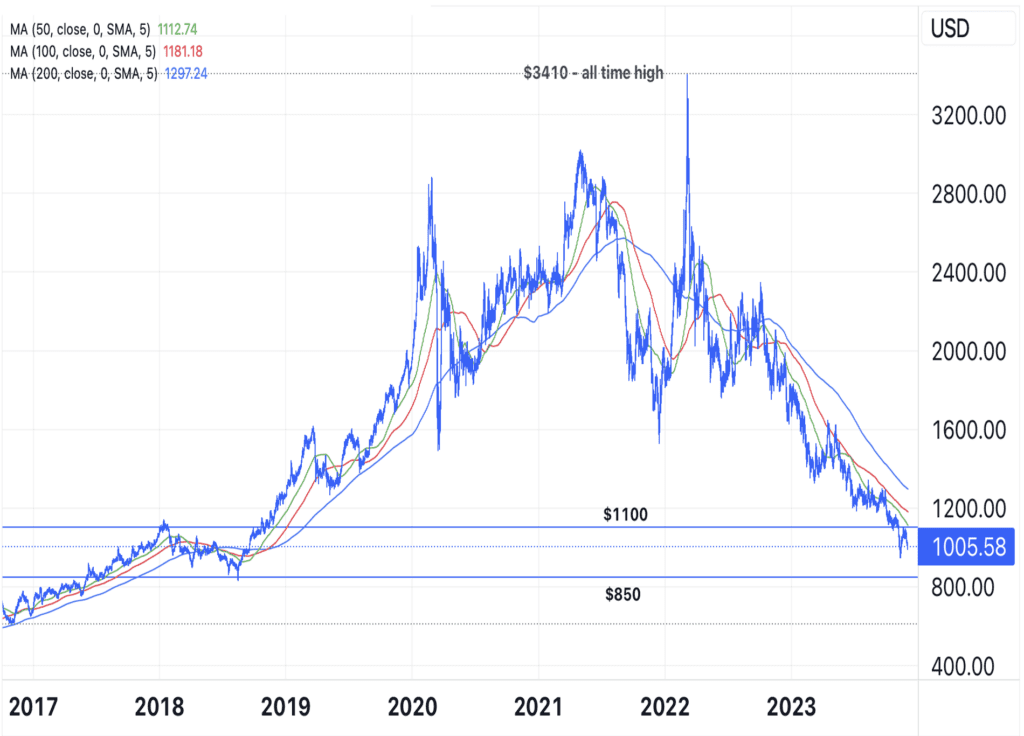
Palladium Chart
Between 2016 and 2022, palladium took centre stage in the precious metals sector with the price surging 658% from $450 in March 2016 to an all-time high of $3410 in March 2022, claiming the title of the ‘most valuable precious metal’ from gold on a combination of growth in the use of palladium in auto catalysts and concerns over supplies from Russia, the world’s leading producer, due to sanctions imposed by the US. However, the picture has changed dramatically this year with the price plunging to a 5-year low of $952 in November amid concerns about industrial demand and with supplies from Russia finding its way on to international markets. Having looked set for a bargain hunting driven recovery into year end, palladium came under renewed downside pressure last week and the safest place for now is on the side lines.
This document is issued by Value Trading BV. While all reasonable care has been taken in preparing this document; no responsibility or liability is accepted for errors of fact or for any opinion expressed herein. Opinions, projections and estimates are subject to change without notice. This document is for information purposes only and for private circulation. It does not constitute any offer, recommendation or solicitation to any person to enter into transaction or adopt any hedging, trading or investment strategy, nor does it constitute any prediction of likely future movements in rates or prices or any representation that any such future movements will not exceed those shown in any illustration.