
“Gold surges towards key resistance pegged at $2050 as the USD US10YT yields plunge”.
Indications only | Closing prices are bids | Prices & Charts : Trading View | Market Research Refinitiv | See disclaimer below
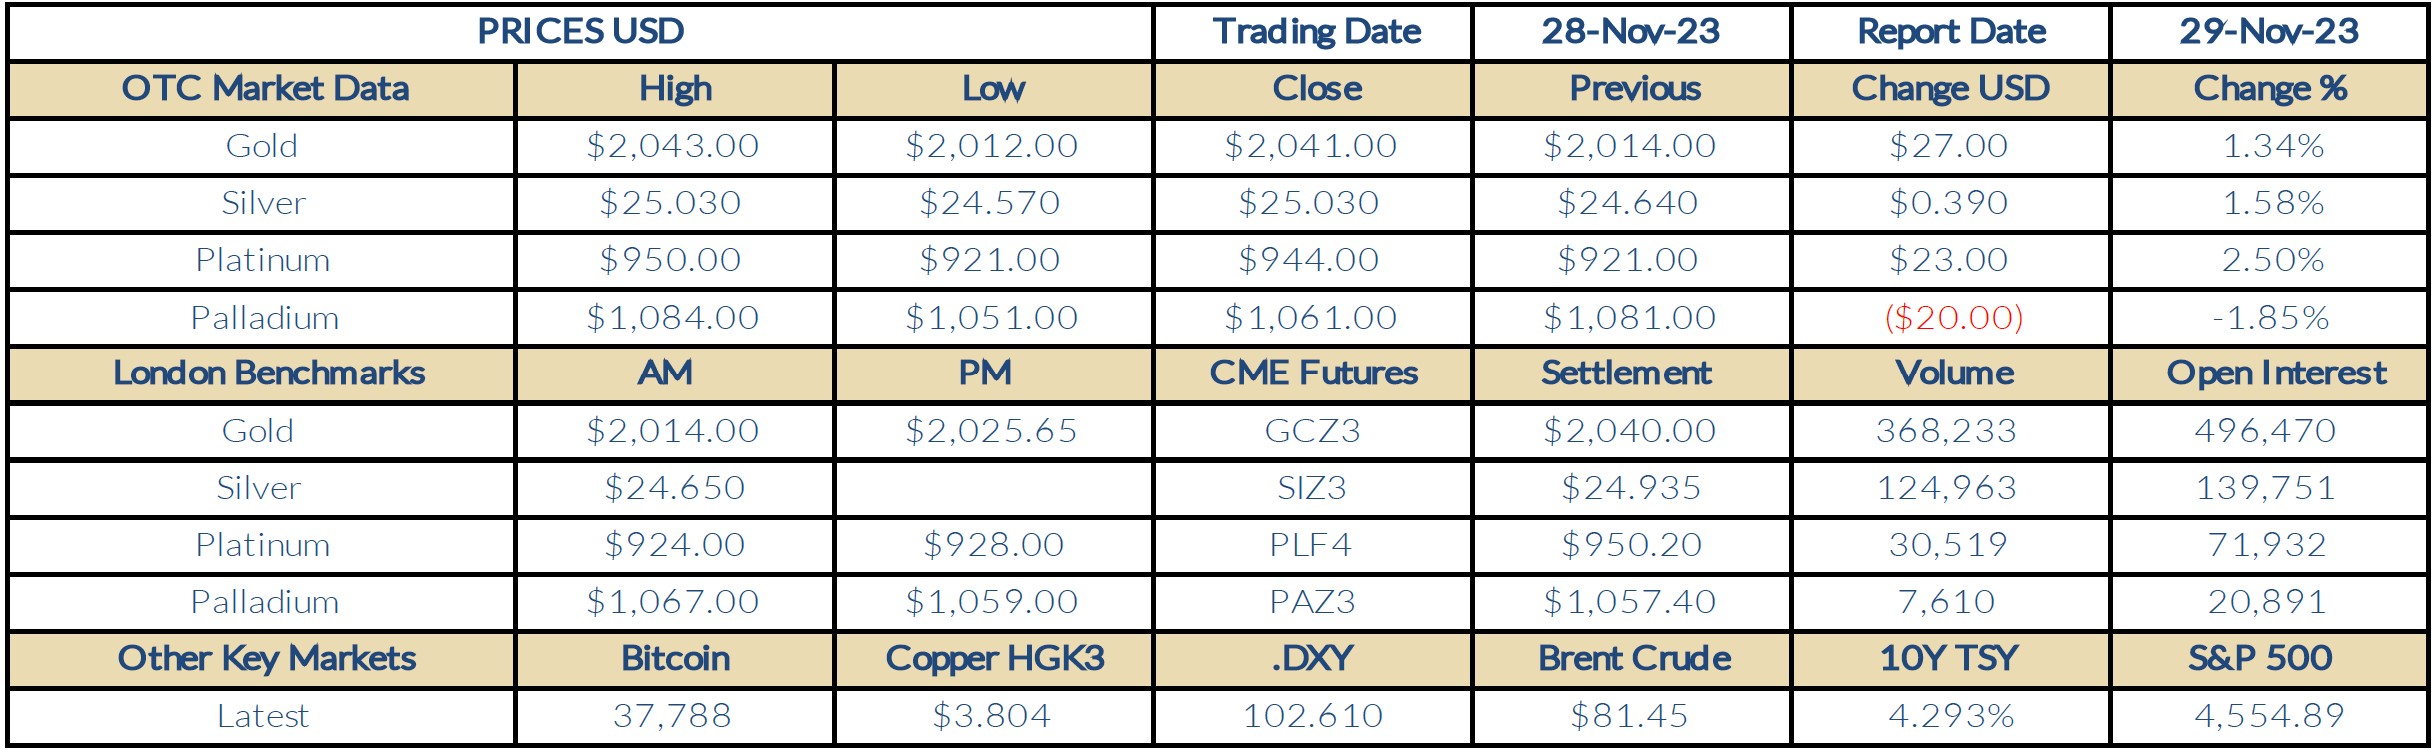
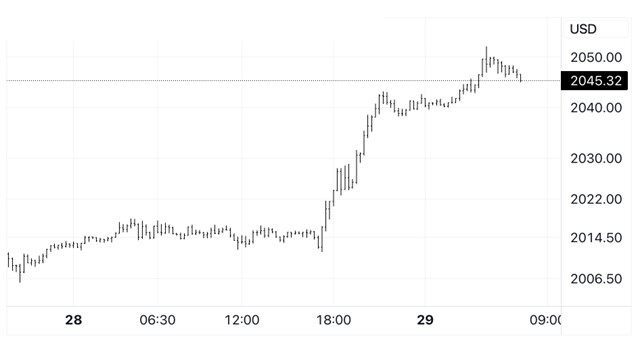
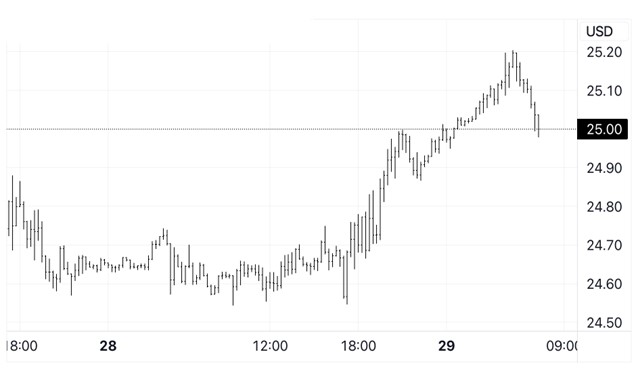
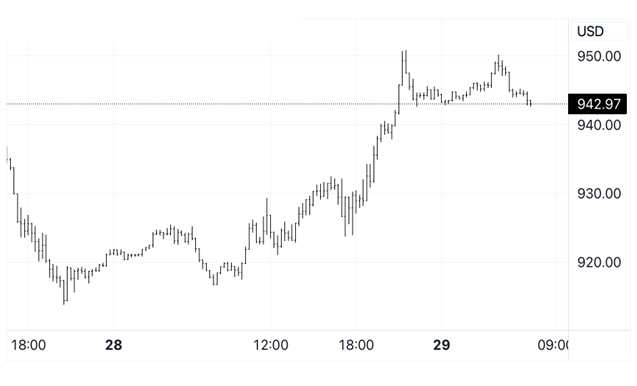
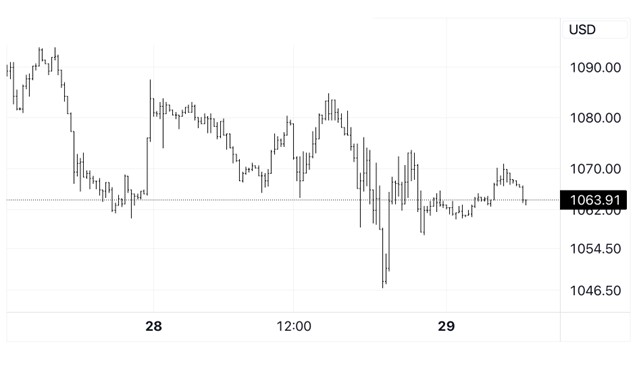
Thoughts for The Day: Gold flatlined in Asia and Europe between a low for the day of $2012 and $2018 on Tuesday, consolidating the break above the pivotal $2000 level, before surging to a 7-month high of $2043 in New York on heavy trading volume as the USD fell sharply and US10YT yields plunged on dovish rhetoric from Fed members that intensified the noise that the next move on interest rates by the US Central Bank will be to cut next year. The yellow metal ended up 1.34% at $2041 and has extended its’ rally this morning to reach $2052 and looks set for a volatile session with the record high of $2077, posted on 4th May this year, within touching distance. However, this latest spike has left gold extremely overbought with a 30-day RSI reading of 71 and is clearly vulnerable to a correction back to support located at $2010. The potential trading range today is $2055 to $2025. Silver tracked gold higher as the industrial metal reclaimed a foothold above $25 for the first time since July, ending on the highs and up 1.58% at $25.03; platinum posted a sector leading gain of 2.5% to $944, but palladium bucked the bullish trend to end down 1.85% at $1061.
Market Commentary: November 29, 2023, (source Reuters)
- Gold prices touched a nearly seven-month high on Wednesday propelled by an extended decline in the U.S. dollar and bond yields as markets grew confident that the Federal Reserve would likely cut rates by the first half of next year. Spot gold rose 0.3% to $2,047.21 per ounce by 0236 GMT. U.S. gold futures for December delivery rose 0.4% to $2,047.80 per ounce.
- The dollar index slid to a more than three-month low, against its rivals, and was eyeing a nearly 4% fall for November, its worst monthly performance in a year. A weaker dollar makes gold less expensive for other currency holders.
- Yields on 10-year Treasury notes fell to an over two-month lows of 4.2860%. Fed Governor Christopher Waller – a known hawkish and influential voice at the central bank – on Tuesday flagged a possible rate cut in the months ahead, feeding market expectations that U.S. rates have peaked. Traders widely expect the U.S. central bank to hold rates in December, while pricing in a more than 70% chance of easing in May next year, compared to a 50% chance a day earlier, CME’s FedWatch Tool shows. Lower interest rates reduce the opportunity cost of holding non-interest-bearing bullion.
- Australia’s inflation eased more than expected in October as goods prices fell, a result that affirms the case for the central bank to keep interest rates unchanged next week.
- Hamas and Israel were expected to release more hostages and prisoners on the last day of a prolonged six-day truce in the Gaza Strip conflict, as attention focused on whether mediator Qatar could negotiate another extension.
- Spot silver gained 0.4% to $25.09 per ounce; platinum was steady at $939.83; palladium rose 0.4% to $1,059.69 per ounce.
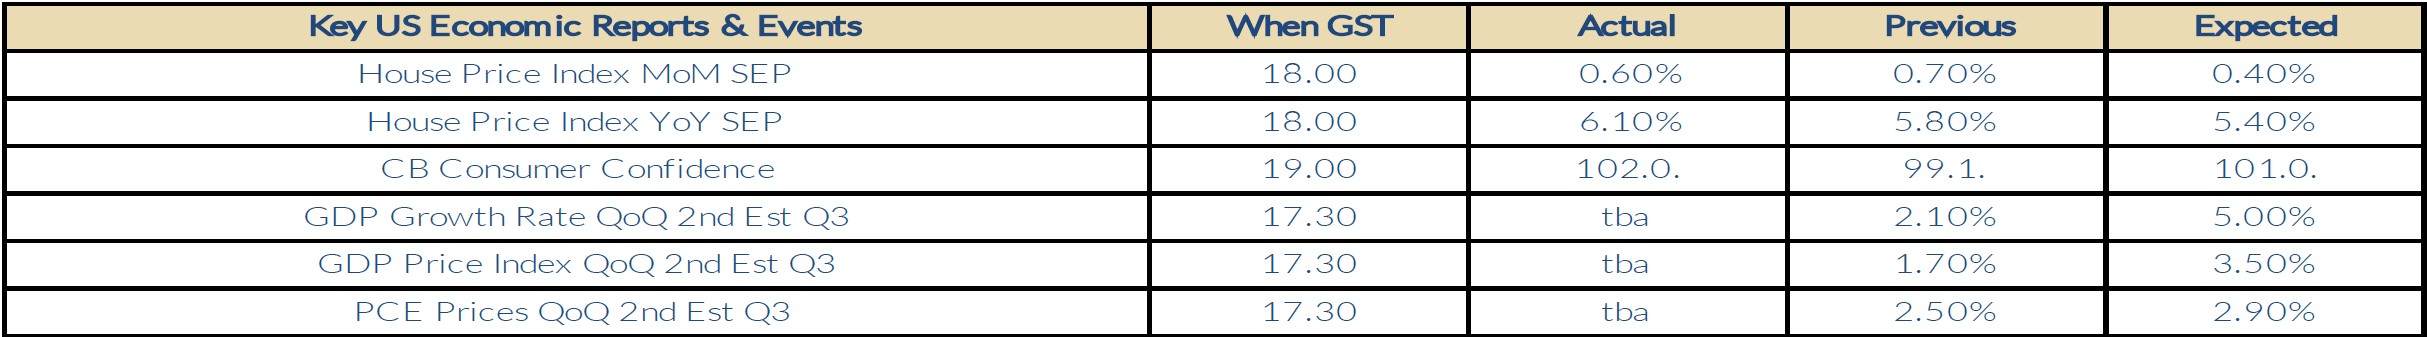
Economic Analysis (Trading Economics):
The average prices of single-family houses with mortgages guaranteed by Fannie Mae and Freddie Mac in the United States increased by 0.6% from the previous month in September 2023, after an upwardly revised 0.7% rise in August and surpassing the market consensus of 0.4%. Looking at the third quarter as a whole, house prices showed a quarter-on-quarter increase of 2.1% and a year-on-year growth of 5.5%. “U.S. house price growth continued to accelerate in the third quarter, appreciating more than in each of the previous four quarters,” said Dr. Anju Vajja, Principal Associate Director in FHFA’s Division of Research and Statistics. “House prices rose in the third quarter in all census divisions and are higher than one year ago, driven primarily by a low supply of homes for sale.”. source: Federal Housing Finance Agency
Gold Chart
Silver Chart
Platinum Chart
Palladium Chart
This document is issued by Value Trading BV. While all reasonable care has been taken in preparing this document; no responsibility or liability is accepted for errors of fact or for any opinion expressed herein. Opinions, projections and estimates are subject to change without notice. This document is for information purposes only and for private circulation. It does not constitute any offer, recommendation or solicitation to any person to enter into transaction or adopt any hedging, trading or investment strategy, nor does it constitute any prediction of likely future movements in rates or prices or any representation that any such future movements will not exceed those shown in any illustration.